Profitability
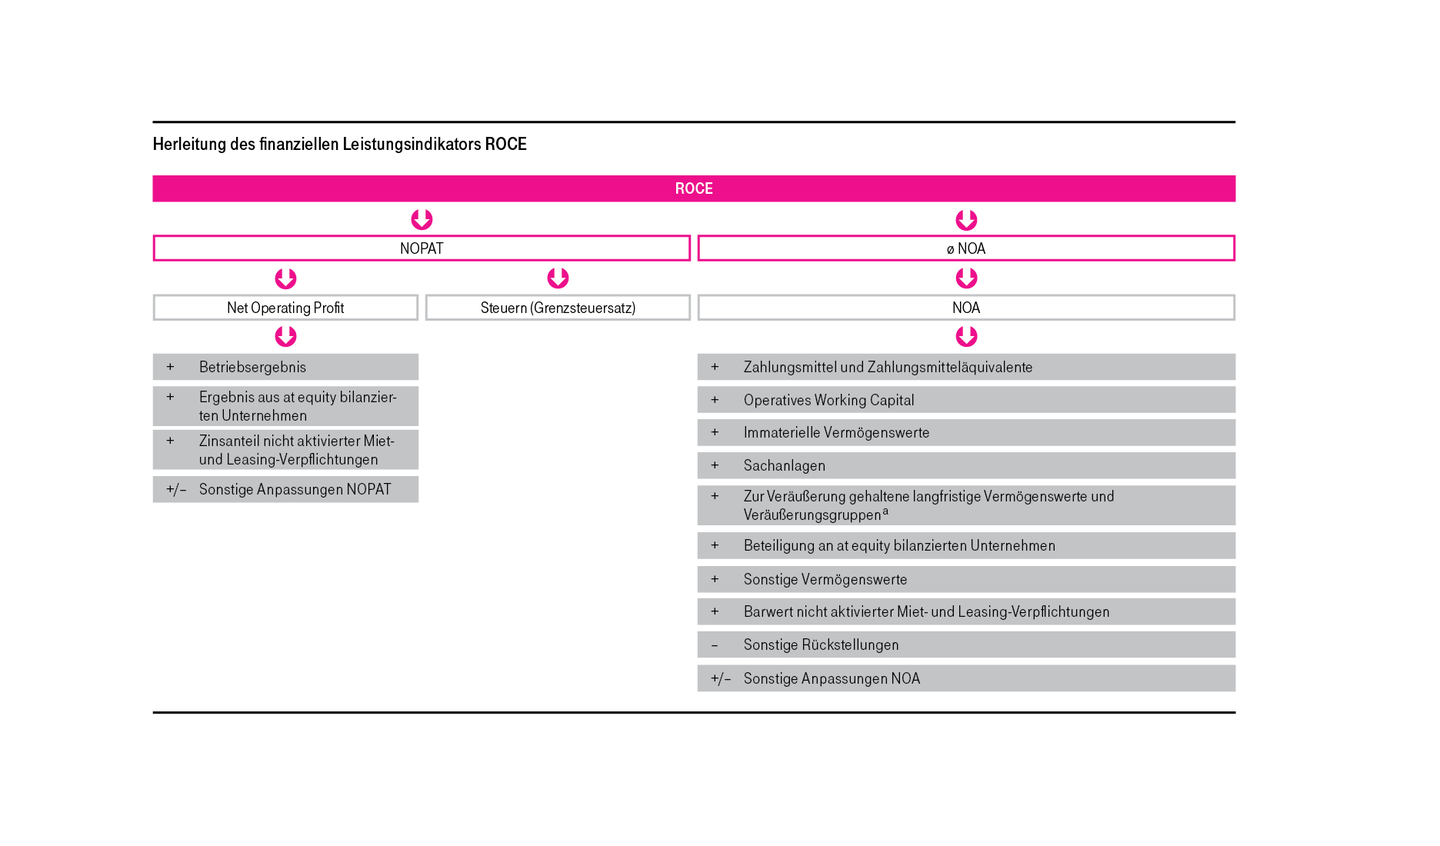
To emphasize how important long-term, sustainable development is to us, we have anchored sustainable value creation in our medium-term objectives and implemented it as a key metric across the Group. Our main management metric is Return on Capital Employed (ROCE). To calculate ROCE, we relate Net Operating Profit After Taxes (NOPAT)—which is operating profit after depreciation and notional taxes—to the average net operating assets (NOA) required over the course of the year.
We use the performance indicator ROCE to anchor our goal of sustainable value creation throughout all operational activities. We generate additional value when the return on capital employed exceeds the cost of capital. Our aim is to meet or surpass the return requirements of debt and equity investors, as derived from the capital markets. The benchmark for this return requirement is the cost of capital rate, which we calculate as the weighted average cost of capital (WACC), combining the costs of equity and debt.
a Excluding the book values of companies accounted for using the equity method.
The NOPAT figure is derived from the Group income statement. It is defined before deducting the cost of capital, so we add back the interest portion of unrecognized rental and leasing obligations.
The NOA include all assets that directly contribute to generating revenue. This covers all items on the asset side of the Group balance sheet that are required to deliver services. Operative working capital is calculated from trade receivables and other receivables, inventories, trade payables and other payables, as well as additional short- and long-term assets and liabilities selected according to internal management logic. NOA also includes rental and operating lease obligations recognized on the balance sheet of the lessor or leasing provider, provided these are necessary for operating activities. The amount of other provisions is deducted, as these do not bear interest.
We believe that ROCE best reflects the expectations of our four stakeholder groups described above. This metric measures how efficiently we use the capital we invest. ROCE is especially meaningful for long-term analysis because it considers both the significant assets tied up in our capital-intensive infrastructure and how well those assets are utilized. This highlights the key advantage of this metric: it focuses not on the absolute amount of profit generated, but on how much return is achieved from the capital employed. ROCE has given us a holistic perspective, inspiring us to rethink our investments with fresh ideas.
Revenue and earnings
Revenue represents the value of our business activities. The total revenue depends on how successfully we can sell our products and services in the market. Revenue development is a key indicator for measuring business success. New products, services, and additional sales efforts are only successful if they lead to increased revenue.
EBITDA corresponds to EBIT (operating result) before depreciation and amortization of intangible assets and property, plant, and equipment. EBIT and EBITDA measure the short-term operating performance and success of each business unit. In addition to these two metrics, we use EBIT and EBITDA margins to show these key figures in relation to revenue. This enables us to compare the earning power of profit-oriented areas of different sizes. By considering unadjusted EBITDA/EBIT, we also take special factors into account. This approach supports a holistic view of our costs. However, special factors can distort the presentation of operating activities and make it more difficult to compare results with previous years. For greater transparency, we therefore also adjust our performance indicators. Without these adjustments, statements about the future development of earnings are only possible to a limited extent. Starting from the unadjusted figures, we determine the respective adjusted values. A table in the Combined Management Report shows the reconciliation of EBITDA, EBIT, and consolidated profit/(loss) to the values adjusted for special factors.
Financial flexibility
We define free cash flow as cash flow from operating activities minus net payments for investments in intangible assets (excluding goodwill) and property, plant, and equipment. This key figure is the main benchmark for both debt and equity investors. It measures our potential to further develop the company, generate organic growth, pay dividends, and meet our debt obligations.
Our central Free Cashflow Management team is responsible for ensuring transparency, control, forecasting, and performance measurement of Free Cashflow, with a particular focus on Working Capital. As part of our ongoing efforts to sustainably optimize Working Capital, our priorities this reporting year were to further extend payment terms for our liabilities in Germany and Europe, to evaluate inventory management in Germany and Europe, and to further optimize receivables management across all our operating segments, including initiatives related to the sale of receivables. We intend to continue on this path in the coming years by focusing on the following areas: further extending payment terms for liabilities, and improving receivables and inventory management in the USA, Germany, and Europe.
Cash Capex (before investments in spectrum) corresponds to payments for investments in intangible assets (excluding goodwill) and property, plant, and equipment that are reported as relevant cash outflows as part of Free Cashflow.